3.1. Dark Frames Analysis
In order to learn the behavior of dark frames we conducted two different measurements. The first, was measuring the dark current accumulation for a specific temperature. This was performed by cooling the camera to a previously determined temperature and setting the auto-temperature setting to ’on’. Once the camera reached this temperature and maintained it, we took dark current exposures for several exposure times. As dark frame is the build up of dark current in the image, one would expect it to grow linearly with time. However, we learned that for low temperatures, the camera is cold enough to prevent this charge build. As seen in figure 1, at a
2
higher temperature of −50 degrees celsius, the dark current grows linearly with exposure time. However, one the temperature is lowered to −150, this linearity is lost.
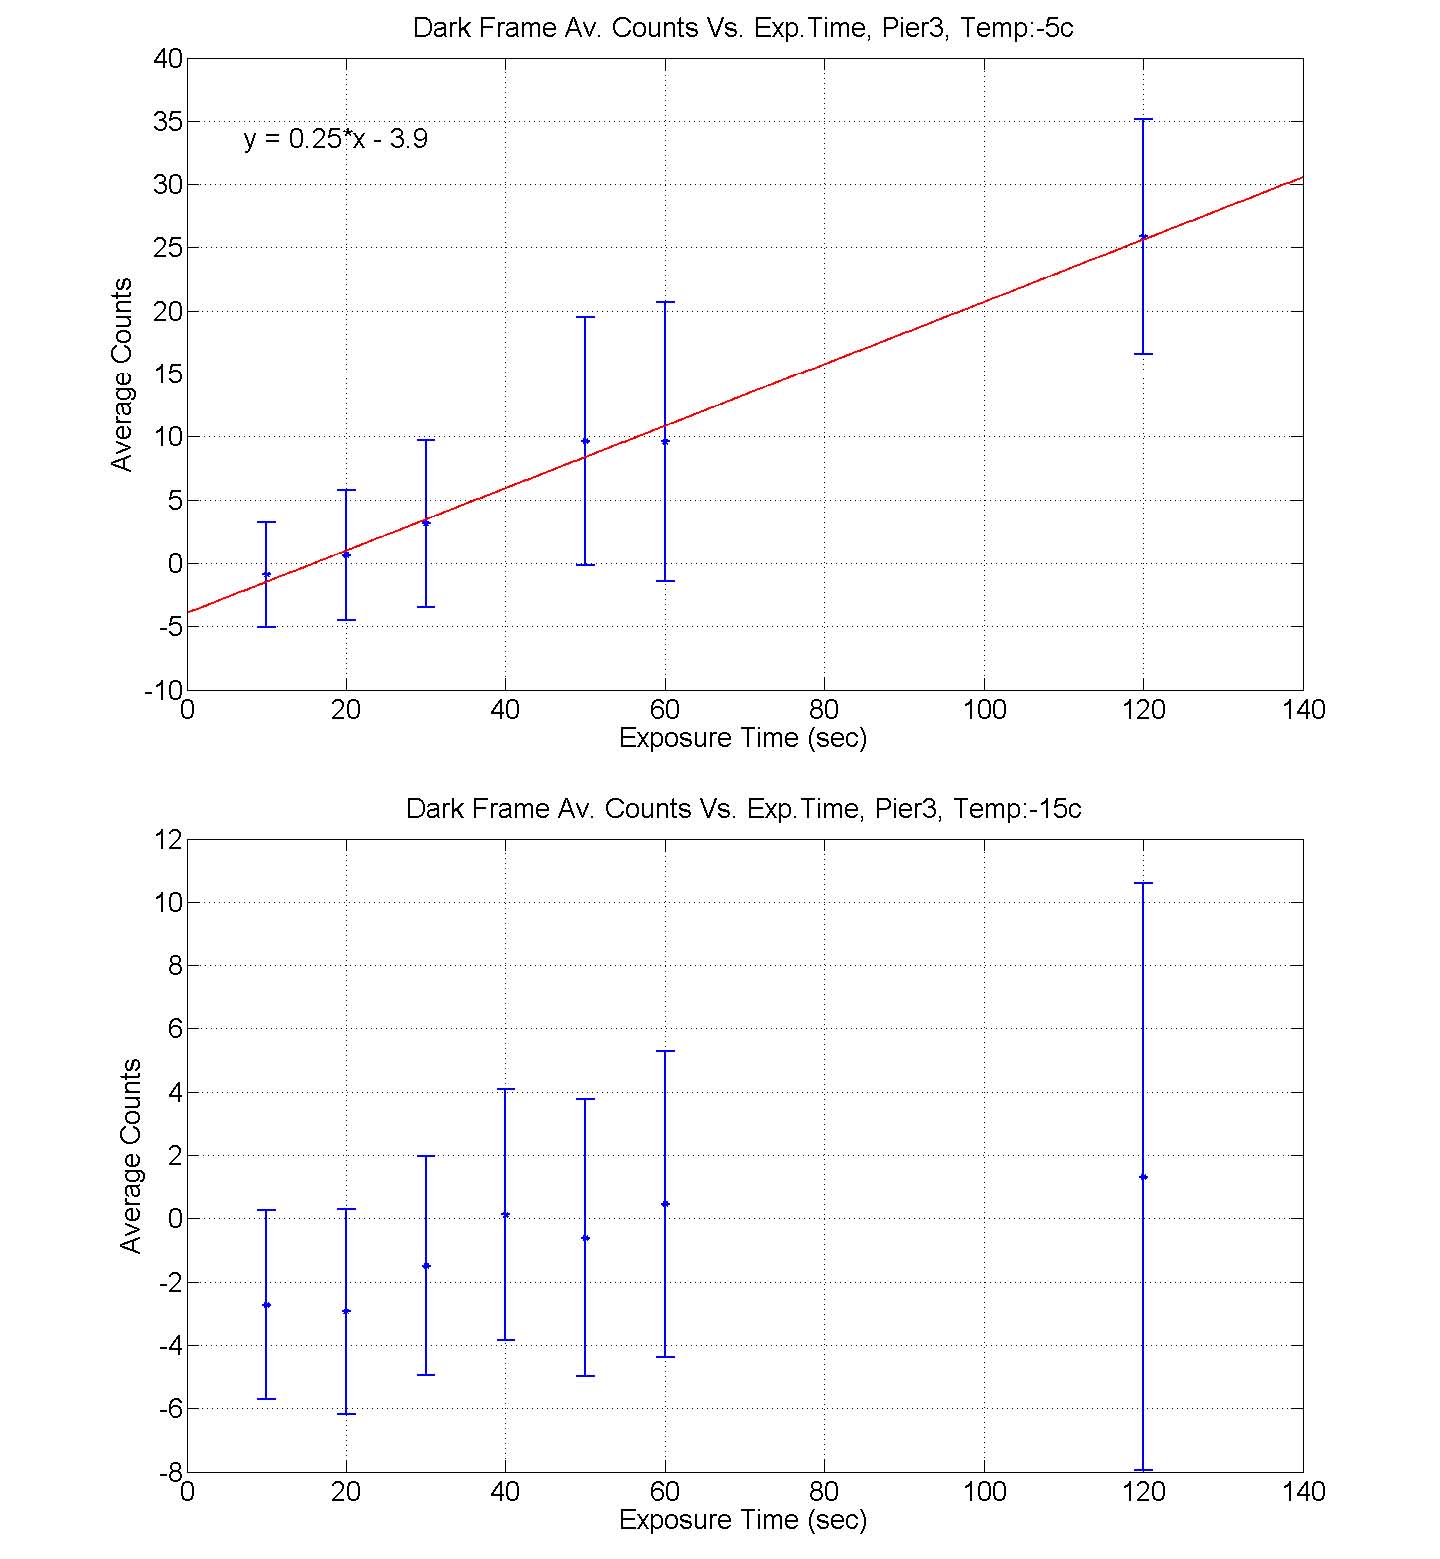
FIG. 1: Average counts Vs. exposure time at −50 and −150 degrees celsius. The upper plot demonstrates the linearity of the dark frames at high temperatures. As the temperature is lowered to −150 (bottom figure), the linearity is lost. The below zero average is an outcome of the bias subtraction which was applied to all frames.
3.2. Error on Magnitude Analysis
The accuracy of photometry depends on different factors as transparency, air mass, magnitude of target star and the calibration of data. As it is hard to predict the influence of these and other parameters on our error, we experimented with different sky conditions to create an estimate on the possible detections. As figure 2 presents, on a clear night through a 2.6 air mass with a blue filter, we can predict the error on the magnitude to be 0.39X −6.1. For a brighter night through 1.5 air mass with the same filter, we predicted the error to be 0.39X − 7.1 which is lower than on a clear night. From this result we can learn the significance of the air mass on the predicted error. More results for different telescope with different filters on different sky conditions can be found on the web https://wikis.mit.edu/confluence/display/WAO/12.410+Project.
4. EXTRA PROJECTS
When observing objects as far as we do, they look circular to us, and we look as a circle to them. In order to interpolate from where
on earth it is possible to observe a 30AU away event, it is necessary to convert a simple drawing of a line on a circle, to an event on the
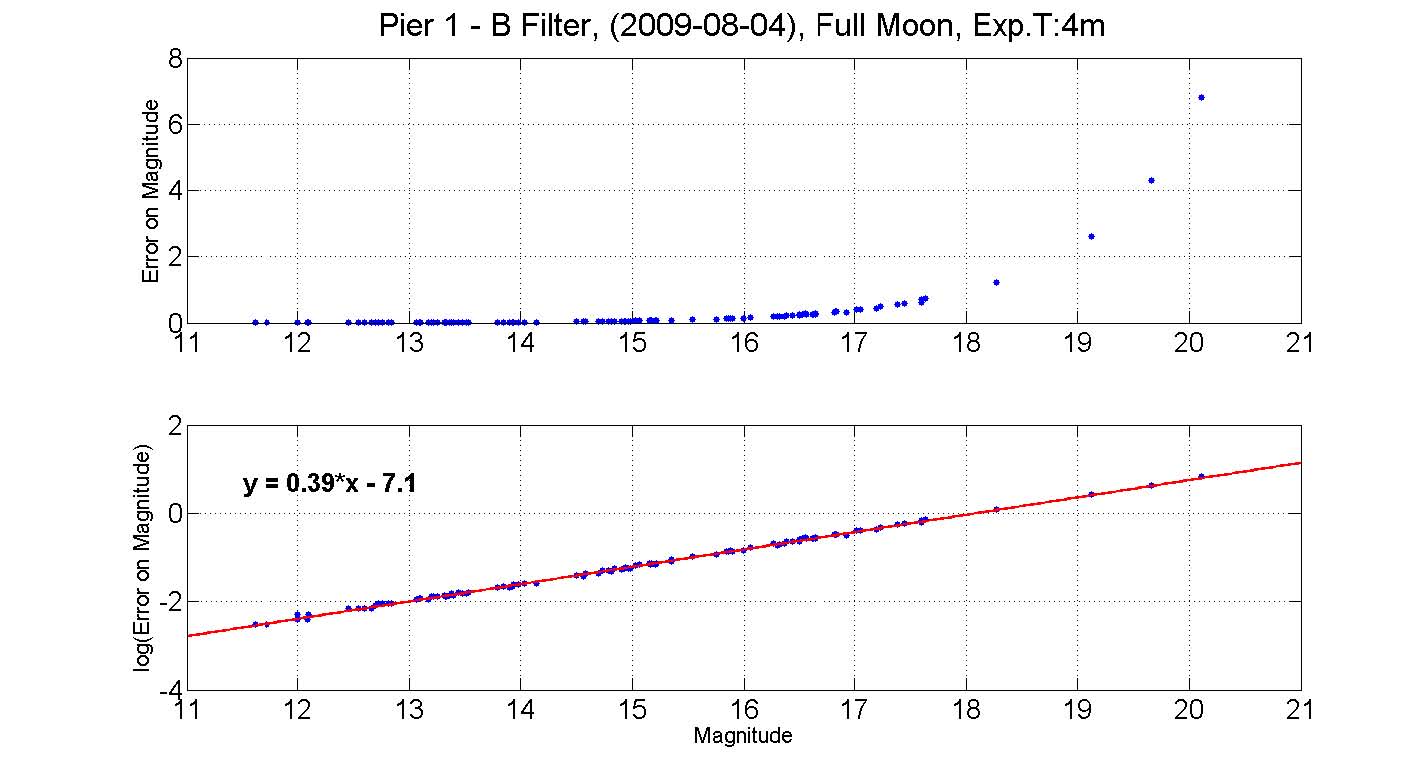
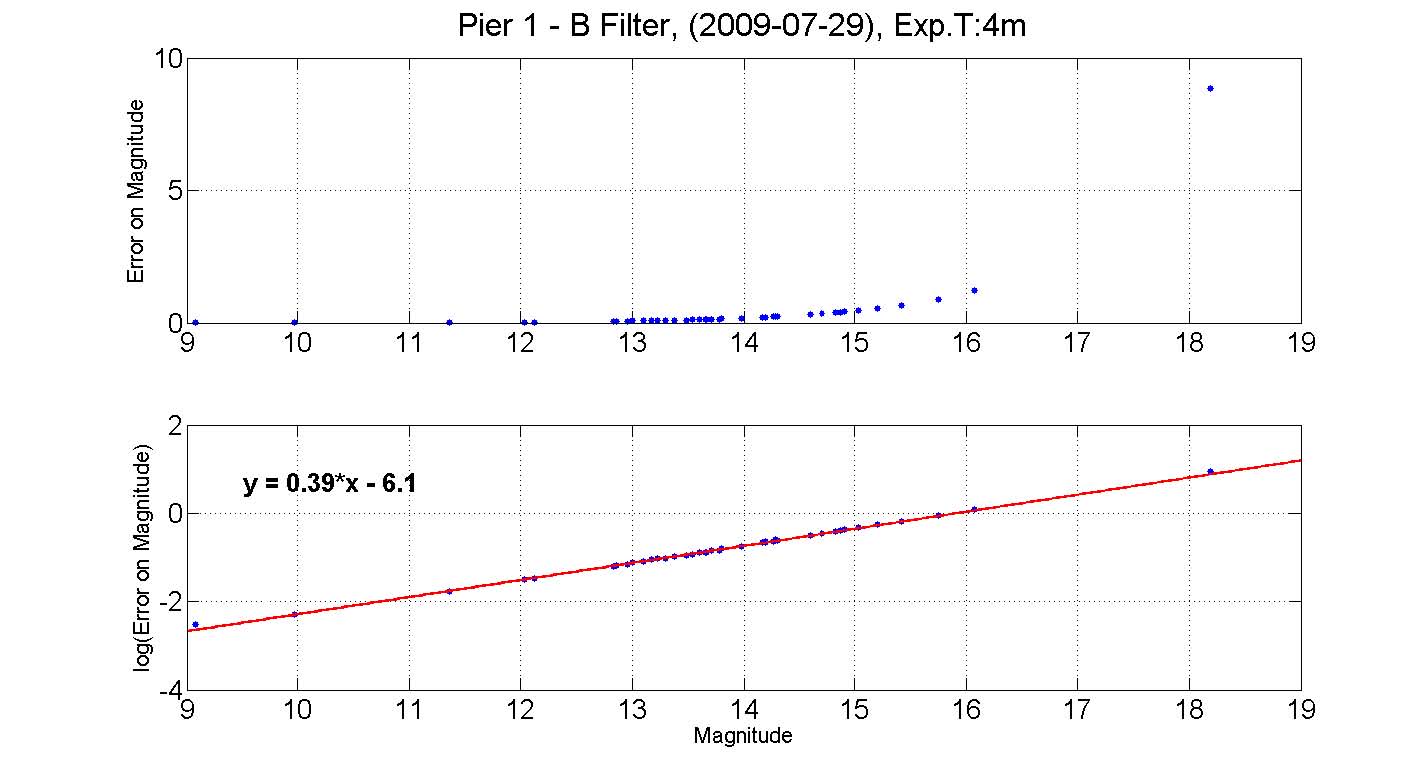
FIG. 2: Error on magnitude vs. magnitude. The data for the upper figure was taken on a full night, 60 degrees away from the moon (considerably dark), with pier 1, blue filter, through 1.5 air mass. A plot of the fit to the log10 of the error reveals the magnitude -error relation to be 0.39X − 7.1. The bottom figure was taken on a dark night with pier 1, blue filter, through a 2.6 air mass. The magnitude -error relation was found to be 0.39X − 6.1. These results among others that can be found on the Wallace Wiki confirm that the derivative of the error is constant, and the sky condition cause a constant shift in the magnitude -error relation
.
globe. Therefore, we wrote a MATLAB code which does exactly this. The code takes as inputs the details of a transit as RA and DEC of target, its distance, the position angle and UT mid-time, and outputs the latitudes and longitudes from which it is observable on earth. The code uses the RA, position angle and distance to compute the line equation from which the transit is observable. The UT mid-time is then used to find the longitude from which the center of the transit is exactly overhead. When converting from cartesian coordinates to spherical ones, we computed the longitudes and latitudes our imaginary line overlaps.
5. CONCLUSIONS