

October 06, 2022
Prediction Last Updated: August 19, 2022
UPDATE 2022-10-04 UT: Analysis of data obtained at the Lowell Discovery Telescope on 2022-10-02 UT shows a smaller than error bars shift in the prediction path.
| |
|---|---|
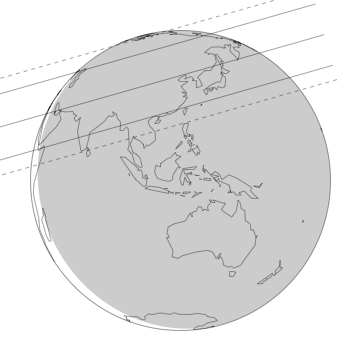
Across the globe pictured, the three solid black lines correspond to the northern limit, centerline, and southern limit of the Triton's shadow. The Northern and Southern limits correspond to a radius of 1353 km. The dashed lines indicate 3-sigma errors. The shaded area on the globe represents where the sun is more than 0 degrees below the horizon. The shadow paths on the globe are an approximation at the geocentric close approach time; they disregard the Earth rotation during the event. | |
|
Table 1: Prediction Details |
|
| Triton Geocentric Mid-time (hh:mm:ss) | October 06, 2022 14:39:37 ± 00:00:27. UT1 |
| Prediction | pred3.0_v1.0 |
| Triton apparent magnitude | 13.4 |
| Occultation Star Gaia DR2 G magnitude | 11.553864 |
| Occultation Star Gaia DR2 rp magnitude | 11.094841 |
| Occultation Star Gaia DR2 bp magnitude | 11.869446 |
| Triton Minimum Geocentric Separation | 0.2042 ± 0.0100 arcsec1 |
| Position Angle (Triton relative to the star; measured north through east) | -15.88 |
1One standard deviation of random error
| |
Table 2: Reference Star Position |
|||
| Reference star position: (Gaia DR3) |
RA (h:m:s; J2000) | Dec (d:m:s; J2000) | Notes |
| Triton.20221006 (Catalog; epoch of occ) | 23:36:52.4514 ± 0.0006 | -03:50:09.7954 ± 0.0004 | |
| Triton.20221006 (Measured) | - | - | |
Potential Star Duplicity: Unknown |
|||
Table 3: Projected KBO Offsets from Reference Ephemeris at the Time of the Event |
|||
| Body | RA (arcsec) | Dec (arcsec) | |
| Triton | 0.0000 ± 0.0100 | 0.0000 ± 0.0100 | See Notes 5 and 6; Includes Triton Center of Light to Center of Body correction |
2Measured position corresponds to RA offset of 0. and Dec. offset of 0.
3All "offsets" are degined in the ("corrected"–"reference") or ("observed"–"calculated") sense. The offsets should be added to reference positions to get the measured positions, which we use to calculate the prediction.
4The reference positions for Triton are those given by JPL Horizon's ephemeris (Triton source file: NEP097f
; Earth center source file: 431mx)
5Data from various telescope were reduced with respect to the Gaia DR2 catalog. A model was developed to fit the residuals obtained from our measured positions compared to that of the object's JPL ephemeris. All residuals obtained from the different telescopes were consistent with the model. The model includes the first-order effects of errors in the orbital elements of the object: (i) constant offsets in RA and Dec, (ii) linear (in time) offsets in RA and Dec, and (iii) potential sinusoidal terms with companion's period. The model was propagated to obtain the predicted position and error of the KBO at the time of the occultation. The errors listed for the KBO are 1 standard deviation. | |||
Table 4: Site Information
|
|||||
Site |
East Longitude |
Latitude |
Site Altitude6 (km) |
Distance7 (km) |
Velocity (km/s) |
Bangkok |
100 30 06 |
13 45 22 |
0. |
1938 S |
23.10 |
Beijing |
116 24 26 |
39 54 15 |
0. |
7 S |
23.02 |
Blagoveschensk |
127 28 58 |
50 19 04 |
0.26 |
499 N |
22.96 |
Hong Kong |
114 10 09 |
22 19 09 |
0. |
1467 S |
23.10 |
Maidanak observatory |
66 53 44 |
38 40 24 |
0. |
779 N |
22.88 |
Mumbai |
72 52 39 |
19 04 33 |
0. |
859 S |
22.99 |
New Delhi |
77 12 32 |
28 36 50 |
0. |
97 S |
22.99 |
Osaka |
135 30 08 |
34 41 37 |
0. |
900 S |
23.03 |
Rikubetsu Space-Earth Science Museum |
143 45 58 |
43 27 22 |
0. |
351 S |
22.99 |
Sanglokh Observatory |
69 13 04 |
38 15 38 |
0. |
727 N |
22.93 |
Sendai Astronomical Observatory |
140 45 19 |
38 15 24 |
0. |
718 S |
23.02 |
Shanghai |
121 28 25 |
31 13 49 |
0. |
845 S |
23.06 |
Taipei City |
121 33 55 |
25 01 58 |
0. |
1412 S |
23.09 |
Thai National Telescope |
98 28 55 |
18 34 55 |
2.547 |
1417 S |
23.09 |
Tokyo |
139 46 08 |
35 40 49 |
0. |
920 S |
23.01 |
Tunka |
103 04 01 |
51 48 36 |
0.680 |
1039 N |
22.96 |
Weihei Obs. of Shandong Univ. |
122 03 02 |
37 32 12 |
0. |
326 S. |
23.04 |
Xinglong Station (NAOC) |
117 34 30 |
40 23 39 |
0. |
4 N |
23.02 |
Yunnan Observatory |
102 46 48 |
25 01 48 |
0. |
923 S |
23.08 |
Geocentric |
.......... |
.......... |
-6378.14 |
4291 S |
22.68 |
6Altitude of each observatory is measured in kilometers above sea level.
| |||||
Table 5: Triton
Occultation Predictions for Individual Sites |
|||||
Site |
Immersion (UT)8 |
UT Mid-Time |
KBO Altitude |
Solar Altitude8 |
Emersion (UT)8 |
Bangkok |
........ |
14:40:38 |
65 |
-53 |
........ |
Beijing |
14:37:57 |
14:38:55 |
46 |
-50 |
14:39:54 |
Blagoveschensk |
14:37:17 |
14:38:12 |
35 |
-44 |
14:39:06 |
Hong Kong |
........ |
14:39:26 |
63 |
-62 |
........ |
Maidanak observatory |
14:40:45 |
14:41:33 |
26 |
-19 |
14:42:22 |
Mumbai |
14:41:26 |
14:42:12 |
40 |
-26 |
14:42:57 |
New Delhi |
14:40:36 |
14:41:35 |
39 |
-29 |
14:42:34 |
Osaka |
14:37:05 |
14:37:49 |
49 |
-61 |
14:38:33 |
Rikubetsu Space-Earth Science Museum |
14:36:25 |
14:37:22 |
38 |
-51 |
14:38:18 |
Sanglokh Observatory |
14:40:39 |
14:41:29 |
28 |
-21 |
14:42:19 |
Osaka |
14:37:05 |
14:37:49 |
49 |
-61 |
14:38:33 |
Sendai Astronomical Observatory |
14:36:40 |
14:37:30 |
44 |
-57 |
14:38:20 |
Shanghai |
14:37:59 |
14:38:45 |
55 |
-60 |
14:39:31 |
Taipei City |
........ |
14:38:51 |
61 |
-65 |
........ |
Thai National Telescope |
........ |
14:40:38 |
60 |
-50 |
........ |
Tokyo |
14:36:51 |
14:37:34 |
46 |
-60 |
14:38:17 |
Tunka |
14:38:43 |
14:39:21 |
33 |
-35 |
14:39:59 |
Weihei Obs. of Shandong Univ. |
14:37:40 |
14:38:37 |
49 |
-55 |
14:39:34 |
Xinglong Station (NAOC) |
14:37:52 |
14:38:51 |
45 |
-50 |
14:39:49 |
Yunnan Observatory |
14:39:27 |
14:40:09 |
57 |
-52 |
14:40:52 |
Geocentric |
........ |
14:39:49 |
........ |
||
8The errors on all times are ± 0:27. (27 seconds; one standard deviation). The solar altitude is given for locations where it is relevant (solar altitude greater than -18 deg). No entry in the immersion and emersion columns indicates that the occultation is not predicted to be visible at that site. | |||||
Webpage generated by C. A. Zuluaga (czuluaga@mit.edu) on October 4, 2022
Please direct all inquiries to PAL (planetary-astronomy@mit.edu)